
The efficient markets hypothesis may very well not be strictly true. But it cannot be false enough that Kalshi’s markets will be severely miscalibrated, can it? Given that so many participants are clearly recreational gamblers, could it be the case that the markets barely beat dumb base-rate baselines?
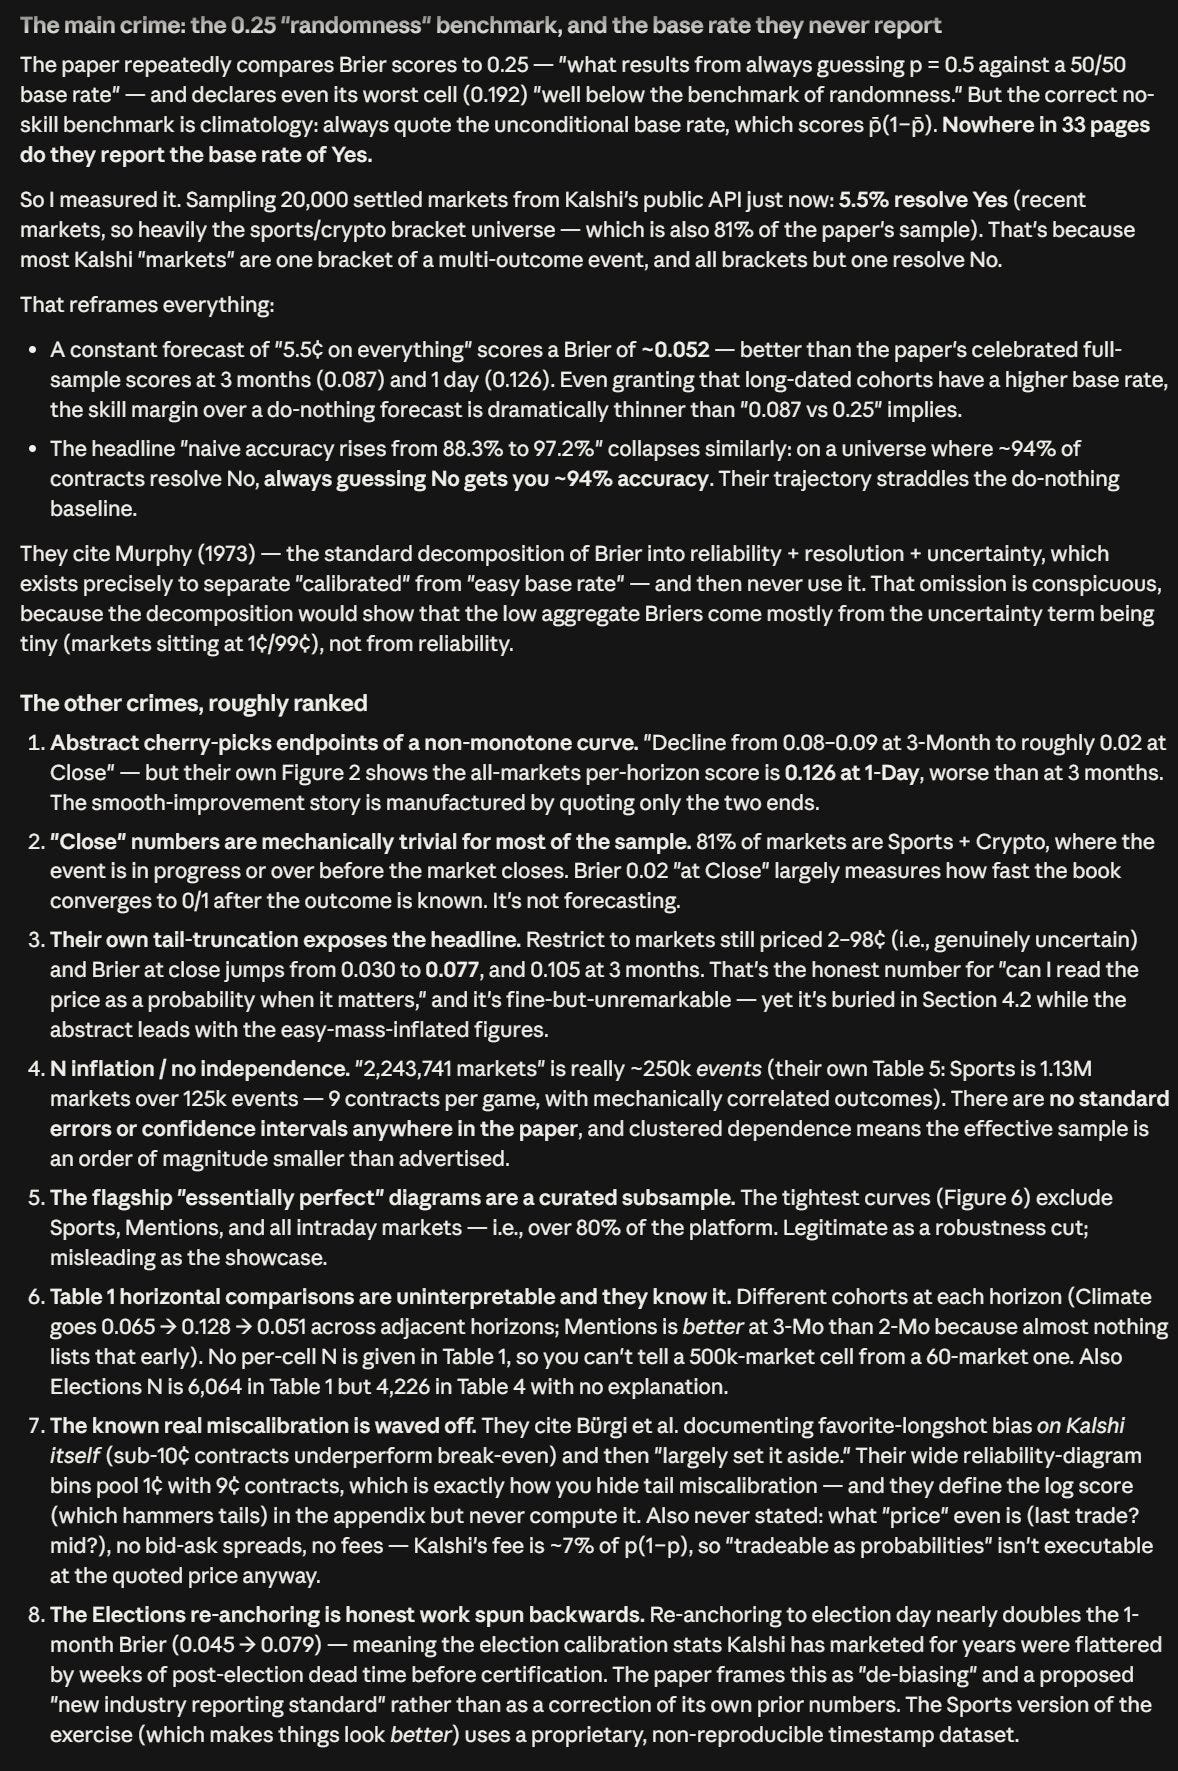
Kalshi Research released a paper on August 20 that showed its markets are well-calibrated, in line with what prediction market enthusiasts have preached for decades. Two days later, Tyler Cowen linked to a critique by X user @DeepDishEnjoyer which pointed out many flaws in the study, including that if you properly take base rates into account, the performance of the markets looks quite poor. People on X also noticed that Kalshi had to exclude the majority of its markets to get its shiniest results. If you include the entire market population, calibration looks significantly worse.
Now those critiques are surprising. We know, e.g., from Tetlock’s studies, that forecasting skill is a thing, and there is profit to be made by displaying it in the markets. For sure that will make the markets well-calibrated, won’t it?
I have downloaded data from every market in Kalshi’s history and replicated most results from the paper as well as the analysis made by the X posts I linked above. In this post I will share the mental model I arrived at. I will explain it first here then expand and share some charts.
To a first approximation, Kalshi is a gambling platform. Gamblers like noisy markets, so most of Kalshi is quite noisy and you should expect the overall performance of the platform to be worse than what you would get by excluding those for-degens markets. So you could say that excluding those markets is a form of cheating. I disagree.
Doing that exclusion was a sensible choice. I just don’t care as much about the calibration of contracts on dumb things like whether Trump will say “Barack Hussein Obama” in a speech as I care about forecasts for geopolitical events such as whether Zelenskyy and Putin will speak.
In fact I consider the paper fairly solid, if you read it with a dose of bounded distrust. The authors do have an incentive to make their platform look good, but their results are interesting and mostly track. They claim their markets are well-calibrated, and they actually are. Though they to a large extent leave aside the noisy markets that make up most of Kalshi, those are also fairly well-calibrated. Not that calibration is that high of a bar.
Still, contra @DeepDishEnjoyer’s findings, when you take base rates into account, their markets do show forecasting skill. Even noisy markets show skill, albeit less so. Some criticisms do survive. The paper has some inconsistencies in numbers and definitions which ideally should be corrected. But the paper is good.
In future posts, I will also share evidence that prediction markets are aggregating publicly available information reasonably well. In many domains, their performance looks at least as good as that of existing baselines. But that is not to say that they are providing a highly valuable service to society. They are not really taming public discourse, they are not great hedging instruments, and they certainly are not moving the needle on futarchy. My perspective is that in their current incarnation prediction markets really are mostly about gambling, which I personally care very little about.
Basically I spent the last month obsessing about Kalshi and Polymarket and have many things to say about them. This post is the first in the series, centered on Kalshi’s paper.
Kalshi as a gambling venue
There is this popular notion that prediction markets by and large function as gambling venues. That notion is true. On Kalshi, 96.0% of trading volume is either in crypto or sports, the number for Polymarket is 75.6%.
Just for fun, I asked Sol 5.61 to score markets on both platforms from 1 (“instrumental”) to 5 (“recreational”), with 3 representing “mixed or genuinely ambiguous”. Crypto and sports were almost entirely considered recreational, as one would expect: 99.98% of crypto and sports volume was recreational on Kalshi, 99.89% on Polymarket. Even disregarding crypto and sports, the bulk of the volume is still concentrated on recreational markets. Here is a breakdown of Kalshi’s 2026 listings:
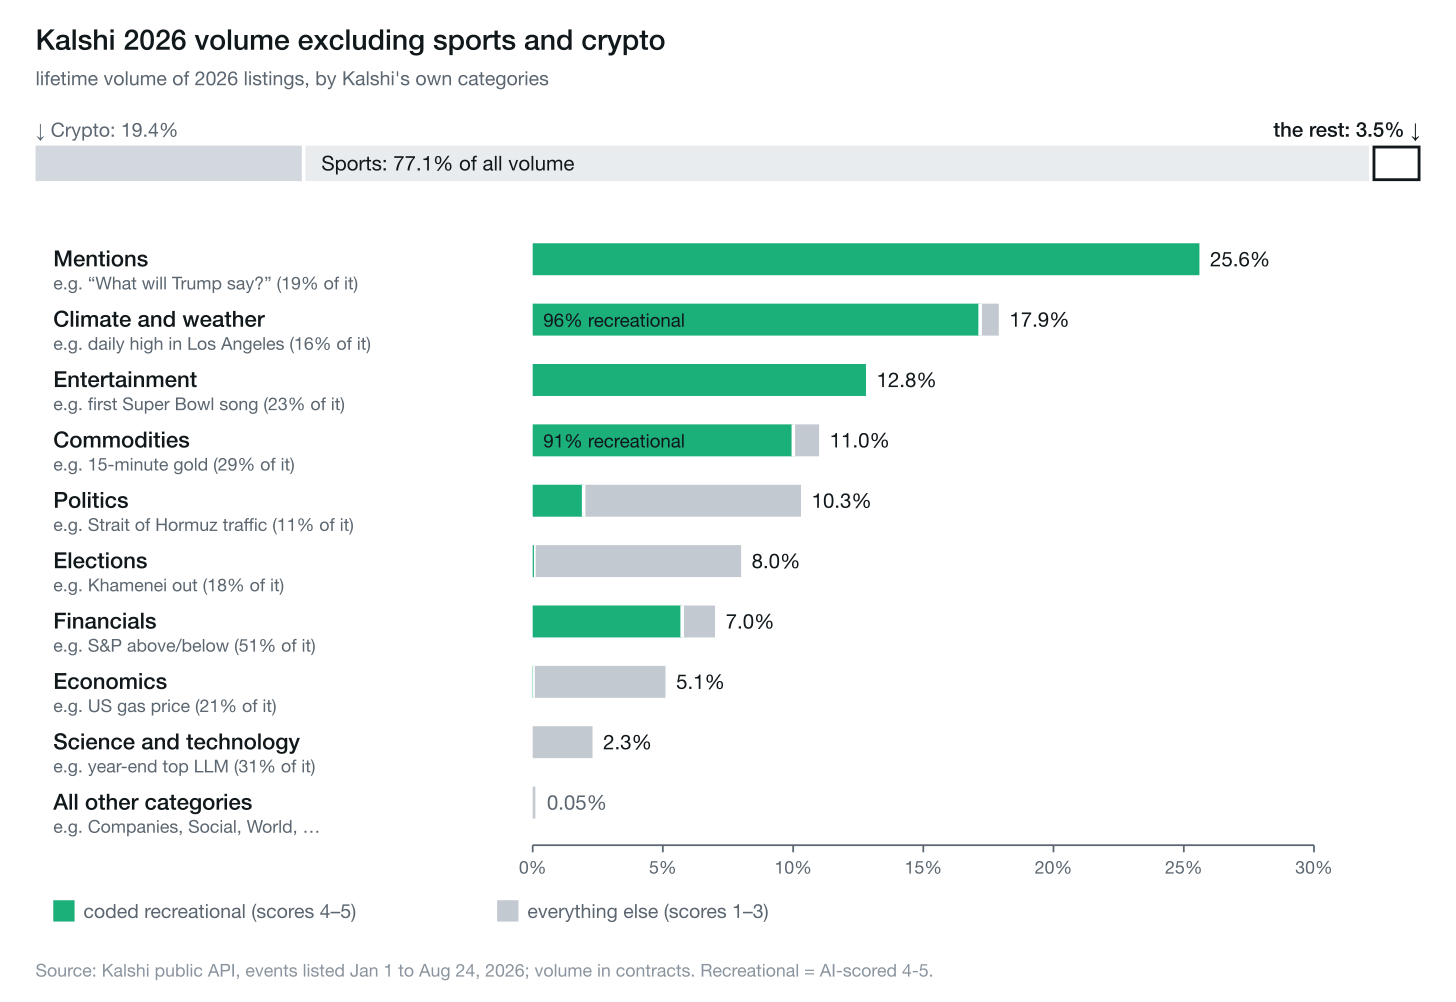
Focusing on the slice of non-crypto, non-sports markets, 73.4% of the volume on Kalshi (29.2% on Polymarket) was still in recreational markets. One caveat worth making is that volume is subject to manipulation. Maybe crypto and sports do not dominate Kalshi all that much, maybe they just have way more wash trading.Sirolly et al. (2025) found that 25% of Polymarket’s volume over 3 years was likely wash trading, with the numbers for Sports and Elections being, respectively, 45% and 17%. So there is some evidence at least that wash trading biases the platform to appear more focused on recreational markets.
The largest category, Mentions, is about betting on, e.g., whether Trump will utter specific words. The third largest category is Entertainment, 23% of which is “first Super Bowl song”. The most “serious” categories are politics and elections.
Notably, climate and weather were overwhelmingly considered recreational, which I found strange since forecasting those is obviously economically important. Upon inspection, I side with the AI on this one. The structure of those markets makes sense if you interpret them as a gambling product that happens to use the weather as a source of noise. They don’t make much sense if the goal was for their prices to be used as forecasts.
For example, the largest series creates a daily market asking traders to forecast the highest temperature that will be recorded by a single station at Los Angeles International Airport (LAX) on a given day. LAX was the 13th busiest airport by passenger traffic last year, and high temperatures can affect aviation (as well as the need for air conditioning), so it isn’t as if anticipating that temperature had no economic value at all. But still, if the point was to offer forecasts for their usefulness, I would expect something more comprehensive than just daily high and low2 at a single spot for all of Los Angeles3.
Financials and commodities are other examples of categories that you would expect to be serious but whose volume is mostly concentrated in recreational markets. That is because a good number of those markets (example) are forecasting binary (up or down) changes in prices during brief horizons of 15-60 minutes. These are simply not good vehicles for hedging, or any other traditional financial use cases, but they do work well for gambling.
Of course you can always come up with stories about why a market is not recreational. Sports gambling can help the sport industry hedge its risks, some say. Similarly, most participants in “serious” markets can still be there for recreation. Election markets are “serious” because elections are important, but I assume they are as popular as they are because betting on them is fun. The estimates of the share of recreational markets I came up with, I would contend, tend to undercount the share of activity done for fun.
Betting was supposed to be a tax on bullshit, making the public debate more accurate by holding pundits accountable. Prediction markets instead became themselves mostly bullshit. Another proposed use case for them was to help organizations make better decisions, which could significantly increase world GDP. I was able to find no decision markets on either platform, and markets whose themes involve corporations are less about helping them operate more efficiently and more about speculating about newsworthy controversies (example).
Now to be fair, Kalshi and Polymarket do not directly claim to help with organizational decision making. Both do, however, claim a fact-checking role. And there are in fact people using them for this purpose. I will argue in a future essay that it is unlikely they are having a big impact disciplining discourse, however.
Manifold does have decision markets. Moreover, only 46.5% of its markets got labeled as recreational by the AI. That is kind of expected given that its small user base draws heavily from communities with many forecasting nerds.
Here is what the share of fun markets over time looks like:
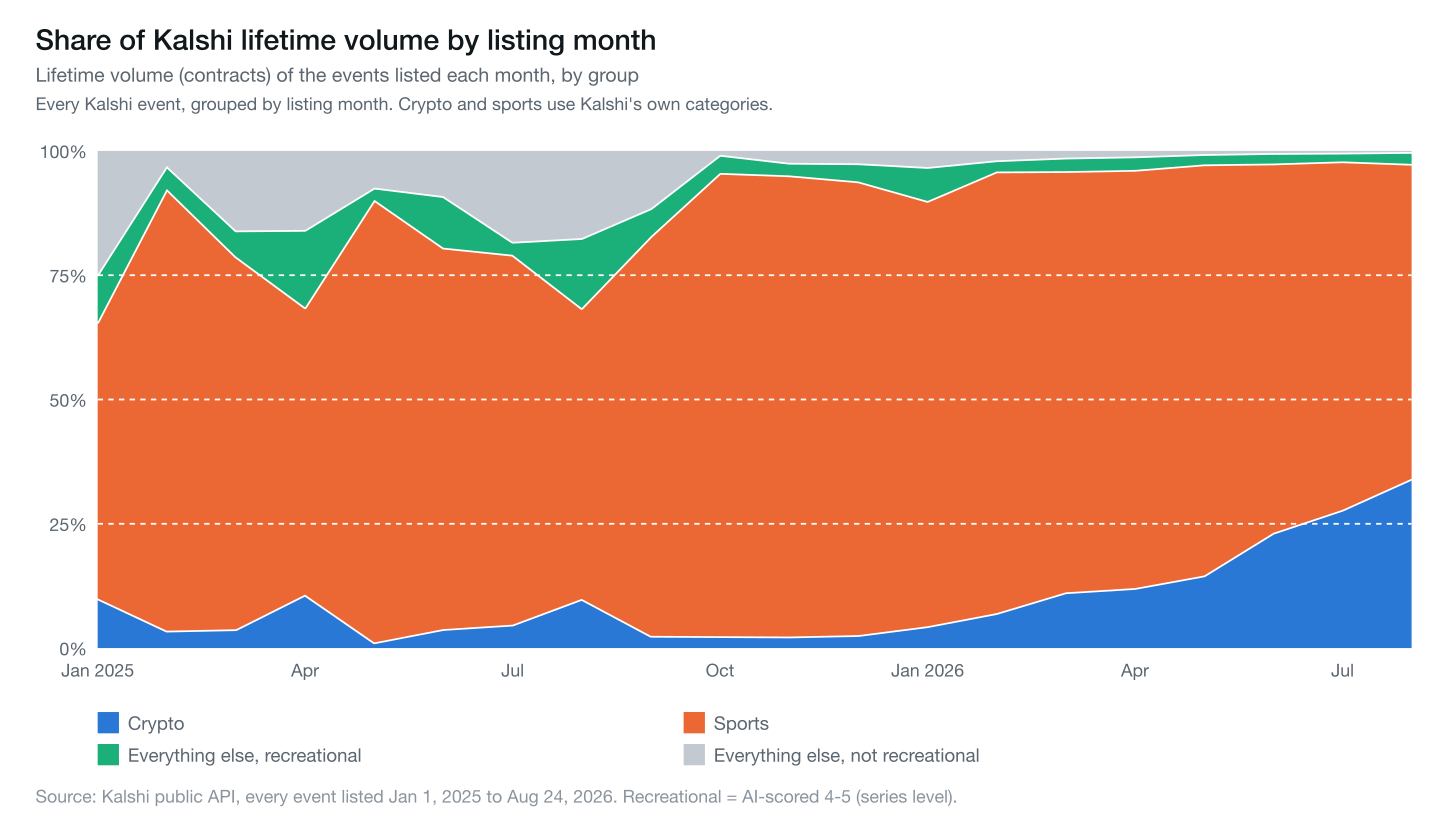
Though it only jumped to being almost 100% recreational around October 2025, recreational markets clearly were a supermajority way before. I am not sure why crypto grew so much in 2026, but it may be due to the blockbuster 15-minute Bitcoin up/down series, launched in December 2025 and taking up 86% of crypto volume in August 2026.
If instead of aggregating on volume we simply count the number of markets, sports take a smaller share but it is still large, and recreational markets are still the overwhelming majority.
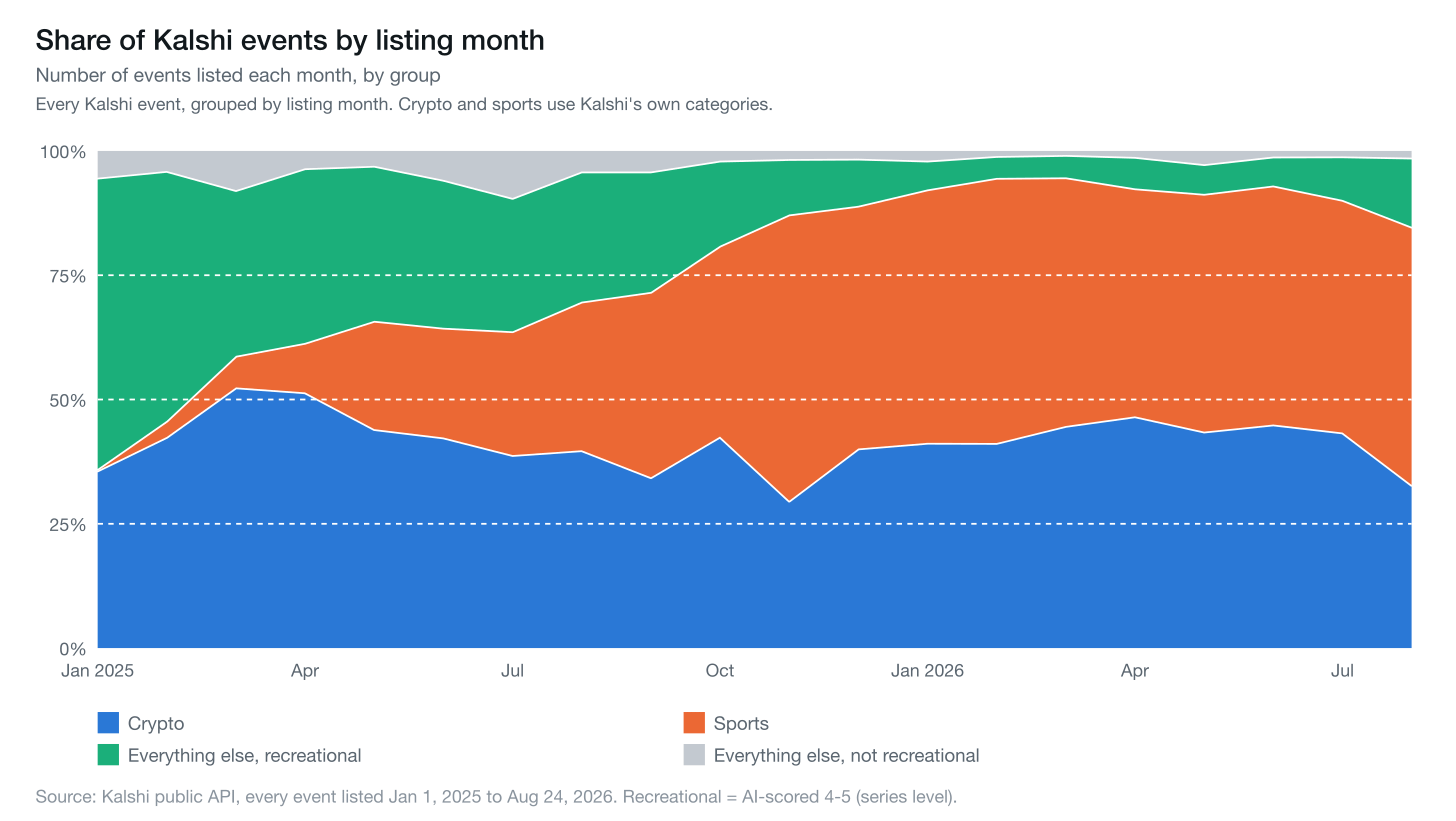
In any case, Kagan and Baiocchi, the authors of Kalshi’s paper, do exclude the noisiest markets from most of their results. Specifically, they exclude markets in the Sports and Mentions categories, as well as short-lived intraday4 markets. Interestingly, they did not exclude Crypto, although the intraday criterion does end up excluding most5 crypto markets anyway. Their criteria do not exclude any “serious” (scores 1 or 2 in the AI-graded scale) markets, but do exclude 85% of the recreational (scores 4 or 5) markets6. So it is approximately correct to say that they chose to mainly study non-recreational markets.
In theory, there are two effects at odds here, which naively would make it unclear whether excluding such markets is the sensible design. First, noise puts a bound on calibration: you can never do better than getting it right 50% of the time if you are predicting a coin flip. On the other hand, the markets called noisy are where most of the activity on the platform happens, and as the authors themselves establish, trading volume is correlated with better forecasts. In practice the first effect appears to dominate, recreational markets empirically display less skill forecasting the future, and I will show that later.
Have you checked the base rate?
Probabilistic forecasts, like those derived from prediction market prices, are commonly evaluated using the Brier score. The Brier score is calculated by taking a bunch of forecasts and averaging their error, so a higher value means the forecasts were worse. When people compete in a forecasting tournament, the winner is whoever ends with the lowest Brier score.
Though we can always say that a lower value is better, in a vacuum it is impossible to say if a given Brier score is good or bad. To decide that we must take into account the question population. As a first baseline, regardless of the precise forecasting tasks, a Brier score of 0.25 is always achievable by predicting 50% on every question. So the expectation is usually that good forecasters will achieve Brier scores below that. At the extreme, if you can always answer the forecasting questions correctly (“What will the result of pressing 2+2= on this calculator be?”) your score will be 0, the best possible. Conversely, if every question is a legitimate coin flip, the best possible value is in fact 0.25, anything below that is just luck.
This makes it hard to evaluate claims like “recreational markets do worse than serious markets” or “Polymarket is better at predictions than Kalshi”. On a fundamental level, recreational questions are not the same as serious questions. Similarly, the markets on Polymarket are not the same as the ones on Kalshi. And even if you pin questions that are identical across the two platforms, the fact that arbitrageurs will exploit any price differences makes the comparison all but meaningless. Any persisting discrepancies could be attributed to factors like different fee structures rather than a fundamental difference in forecasting ability.
Another important baseline to keep in mind when evaluating forecasts is their base rate. Take for example the Kalshi series on MLB games going to extra innings, which runs daily. During cycles from May 2026 to August 2026, markets resolved Yes 8.4% of the time. If you simply predict No will happen with certainty on every market, you will be right 91.6% of the time. In that case, your Brier score would be 0.0847, which naively looks pretty good. As it turns out, the best possible dumb strategy is to bet the base rate8, e.g., bet every market in that MLB series will resolve to Yes with probability 8.4%. If you do that, the Brier score will be slightly better, 0.077.
That number, the Brier score of the constant base-rate forecast, is called the uncertainty of the problem. Uncertainty is a measure of how hard the problem is. A coin flip has maximum uncertainty, 0.25. Uncertainty in the “2+2=?” task is 0. If you are using the Brier score to measure skill in a bunch of forecasting tasks, you should measure the base rate and use it to take the uncertainty into account. A given Brier score will be more impressive if uncertainty turns out to be higher.
But this already places the criticism of Kalshi’s results by @DeepDishEnjoyer into perspective. The abstract of the paper mentions that accuracy rises from 88.3% (88.4% in my replication) at a 3-month horizon to 97.2% (97.3%) at close. In the screenshot shared on X, Fable built a sample of 20,000 recent settled markets and computed a Yes rate of 5.5%. Just as Fable argued there, if that was the base rate, getting 94.5% accuracy would be trivial. All you would have to do is predict a probability of 5.5% of Yes for every question.
But that base rate is wrong. If you use a sample comparable to the paper’s, which included all resolved markets from launch through mid-2026 (I used July 21 as the cutoff for most of my replication), you don't find 5.5% of markets resolving Yes. For that sample, the base rate is actually 39.4%. Using it as a constant forecast, the accuracy you would get is 61%, which is clearly worse than the 88+% achieved by the markets. There is a catch though.
When you read these numbers naively, it looks like the markets start out pretty accurate 3 months out, at 88.4%, then keep improving until they get to 97.3% at close. There is an oddity that cuts against this interpretation however: market accuracy 1 day before resolution is only 81%. It is as if markets start out pretty accurate, then get worse for some reason until at close they finally improve becoming better than ever.
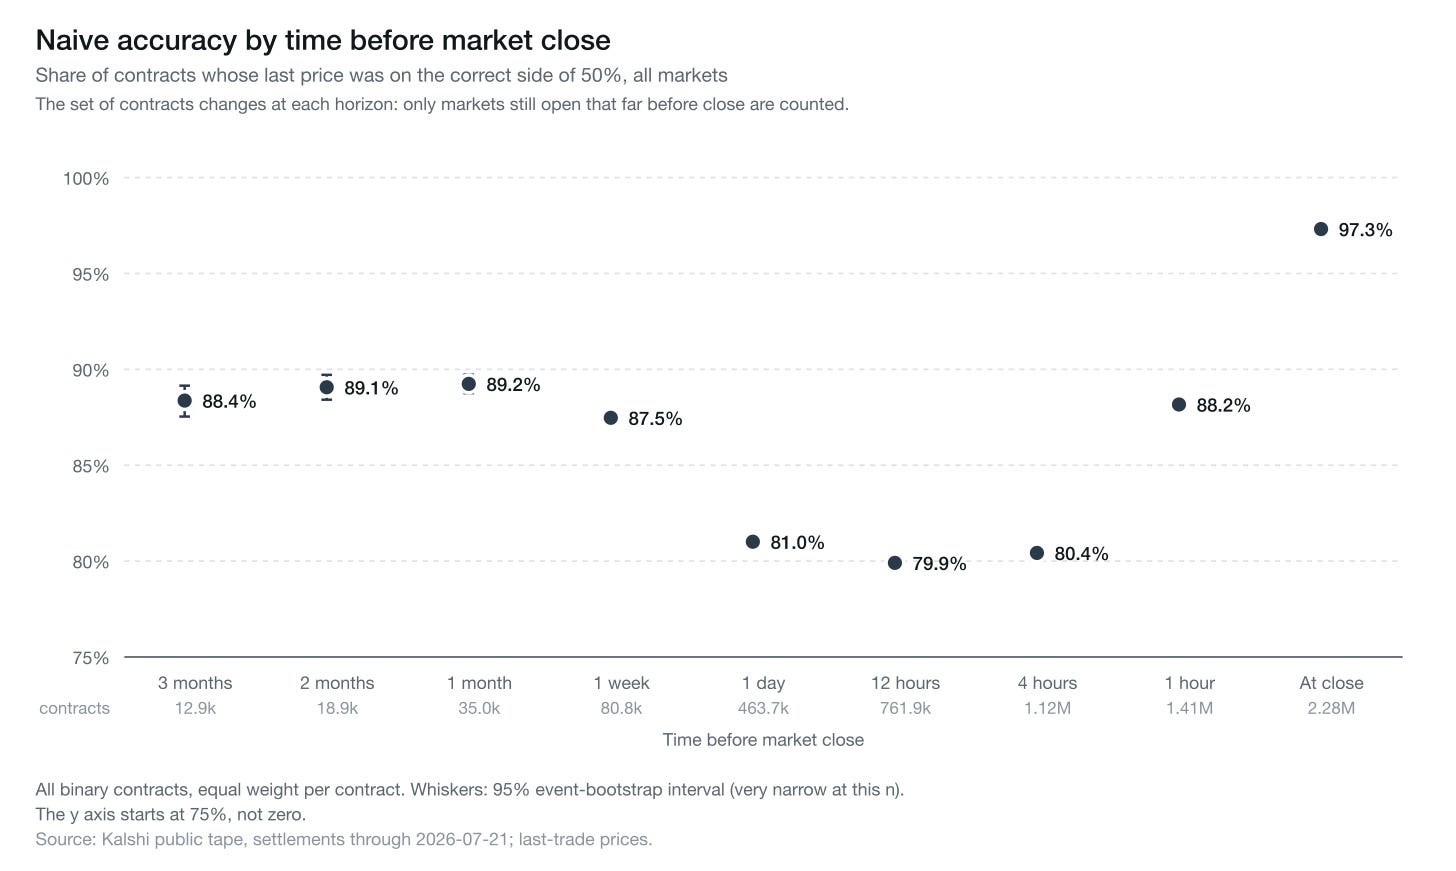
The issue is that the samples are significantly different. Notice first that market lifetime is not homogeneous. Break the entire frame into two groups, one containing only crypto+sports+intraday markets, and the other containing the rest. Here is what the distribution looks like for each group:
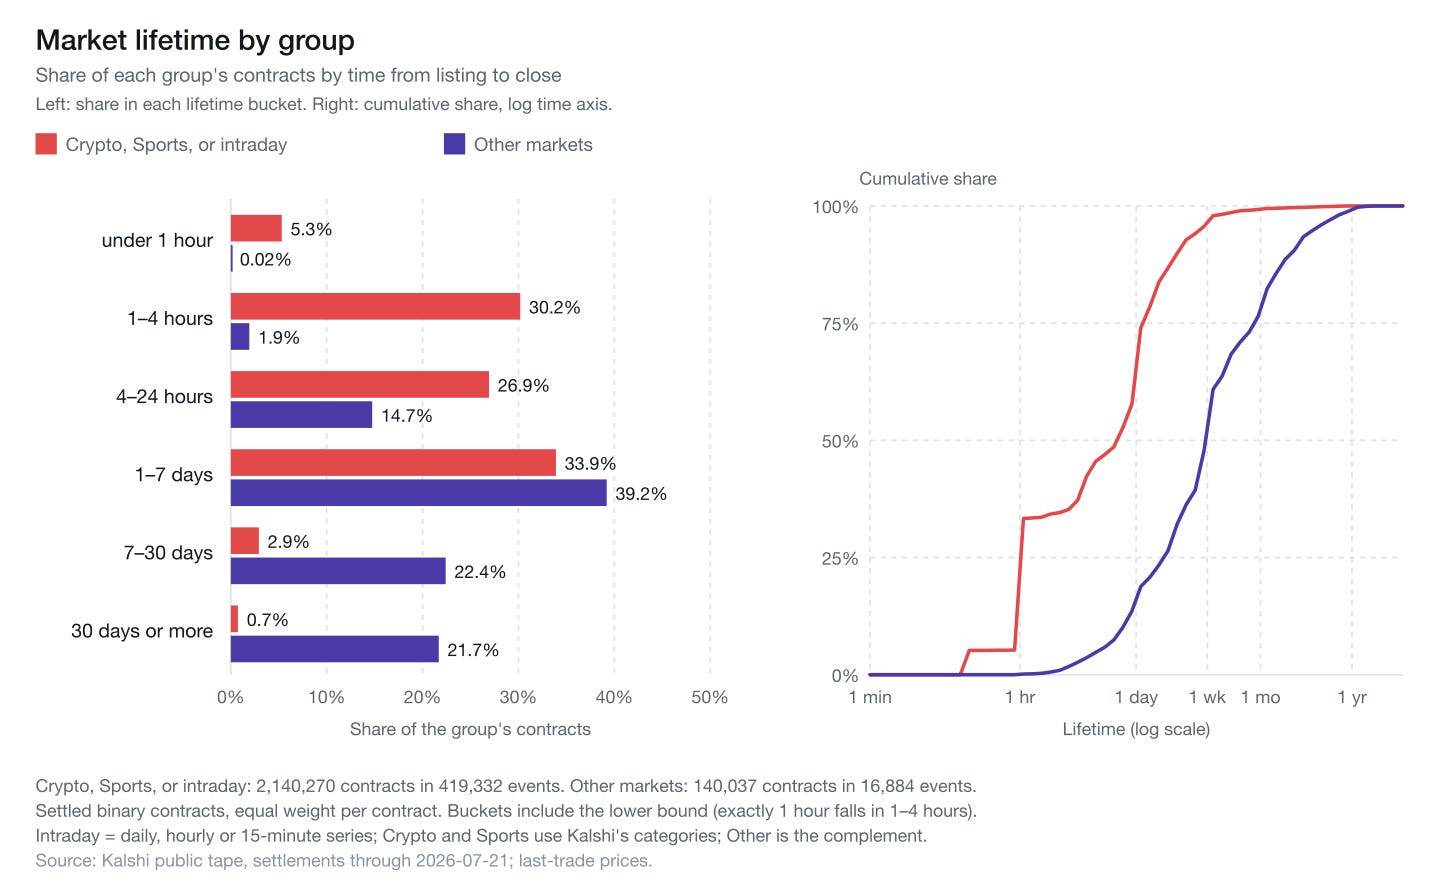
As you can see, noisy markets typically get resolved much sooner after being created. By construction, the sample only includes settled markets. As a consequence, the “at close” statistics include every market in the sample since they all have been settled. But only 0.6% of markets get included in the “3 months out” statistics since the majority of markets don’t live that long.
Of those markets that did exist 3 months before close, only 38% are of the noisy variety. Remember how comparing forecasting performance by checking the Brier score on different question populations is not that meaningful? As it turns out, the population of markets that exists at different time horizons is quite distinct, so it is not meaningful to compare markets at different horizons like this.
In fact, 46% of all markets are intraday. So if you compare statistics at close with statistics 1 day before resolution, you would still be looking at two quite different populations.
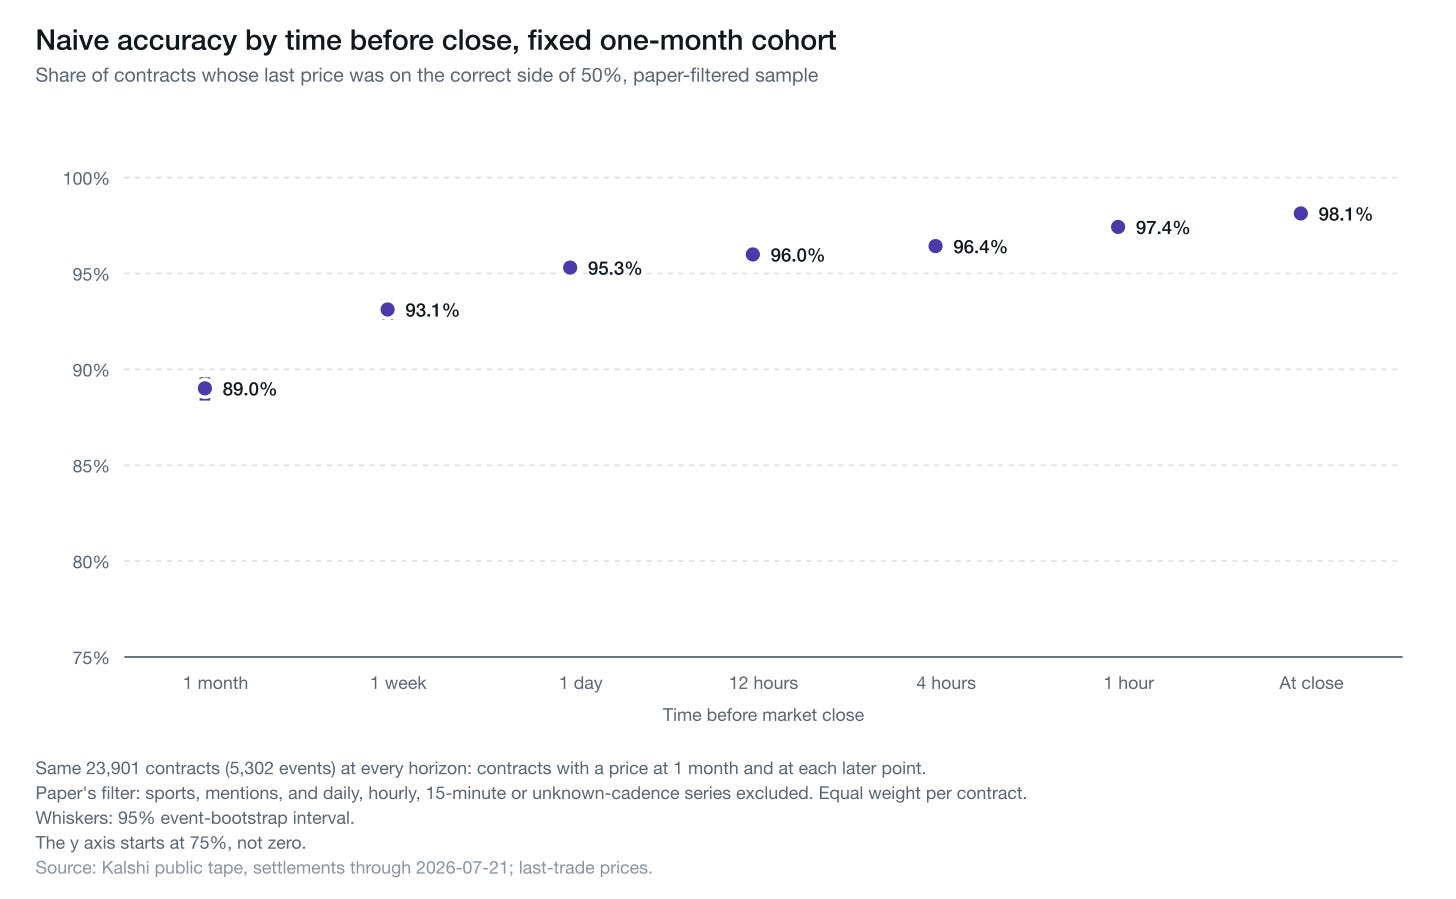
The authors solve this by excluding noisy markets but also by fixing a cohort of markets that existed 1 month out. Here is what the accuracy over time looks like for those:
And this is the same chart except showing the Brier scores:
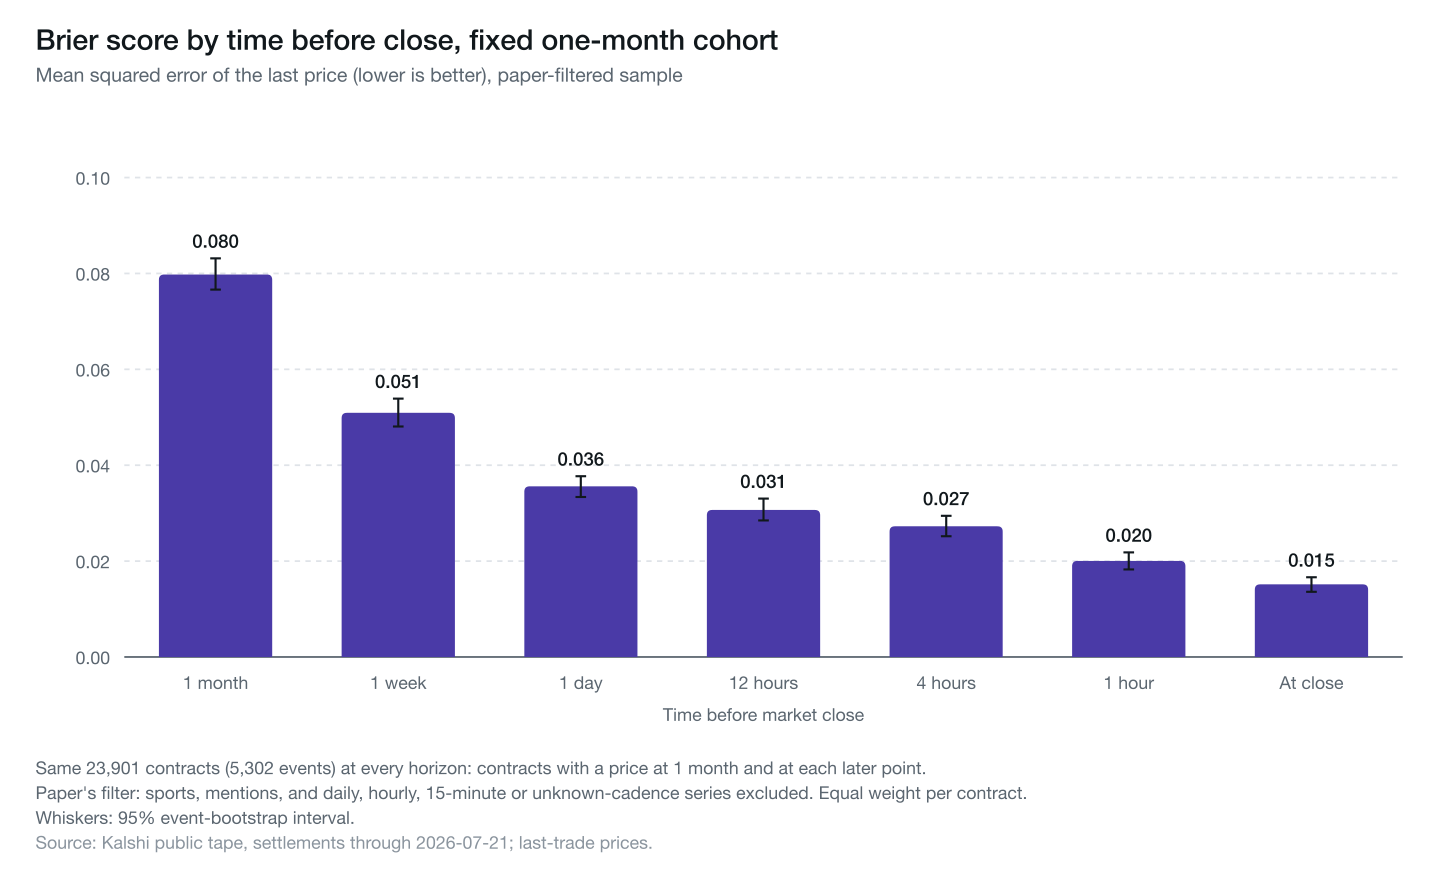
Brier scores already start quite low one month before close, but they keep decreasing as the weeks go by and even during the day just before close. It’s hard to evaluate their performance without having a model of how hard the questions are, but the markets do appear to be functioning well looking at these charts.
There is another factor that could inflate the Brier score for all markets at close. In many markets trading closes “too late”: possibly after a sporting event finished. The authors do take this into account, checking what performance looks like if they re-anchor times, and it moves in inconsistent directions for sports and elections. The paper does not come up with any explanation for the discrepancy. I did not replicate this result and do not have any theories either.
Is that really calibration?
Forecasts are calibrated if their predicted probabilities match observed frequencies. For example, if you predict 100 different questions will settle to Yes each with probability 70% and then 70 of them in fact do, you are perfectly calibrated. Calibration is clearly desirable. If forecasts are not calibrated, you cannot interpret them as probabilities.
Now consider a miscalibration scenario. Suppose you predict a 70% chance for 100 events, then 99 of those happen. Then you predict a 70% chance for a different set of 100 events and 93 of them happen. Let’s assume this remains consistent: whenever you say 70%, we observe the events around 95% of the time. In this scenario your forecasts are obviously very useful and predictive. Yes, they may be miscalibrated. Your 70% really means 95%. But that is easily fixable. I can easily adjust to your miscalibration, and use your forecasts to inform my decisions.
Here is a chart of the calibration for the sample consisting of all markets at 1 month before resolution:
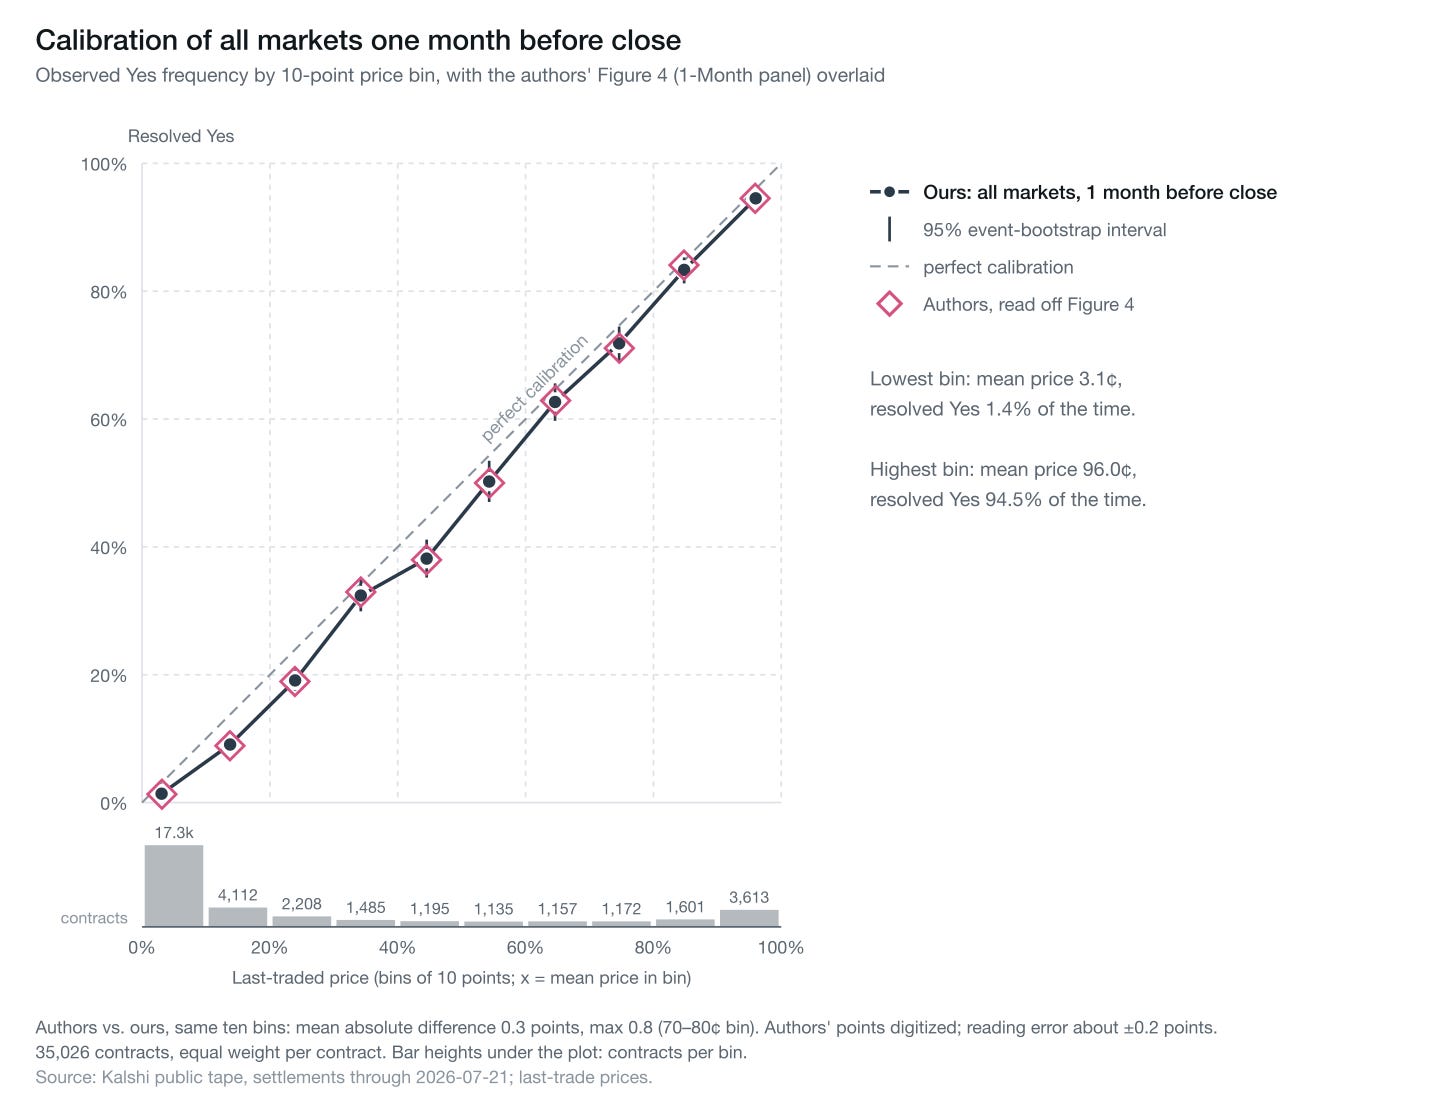
In a chart like this, the diagonal line represents perfect calibration. The fact that the lines are below it means the markets are a bit underconfident (edit: no, it does not). As you can see, my results match the authors’ essentially exactly. The authors include many of these calibration charts, all of which also replicate just fine. Their markets are well-calibrated! To go to the most adversarial example, take a look at the calibration for intraday markets only:
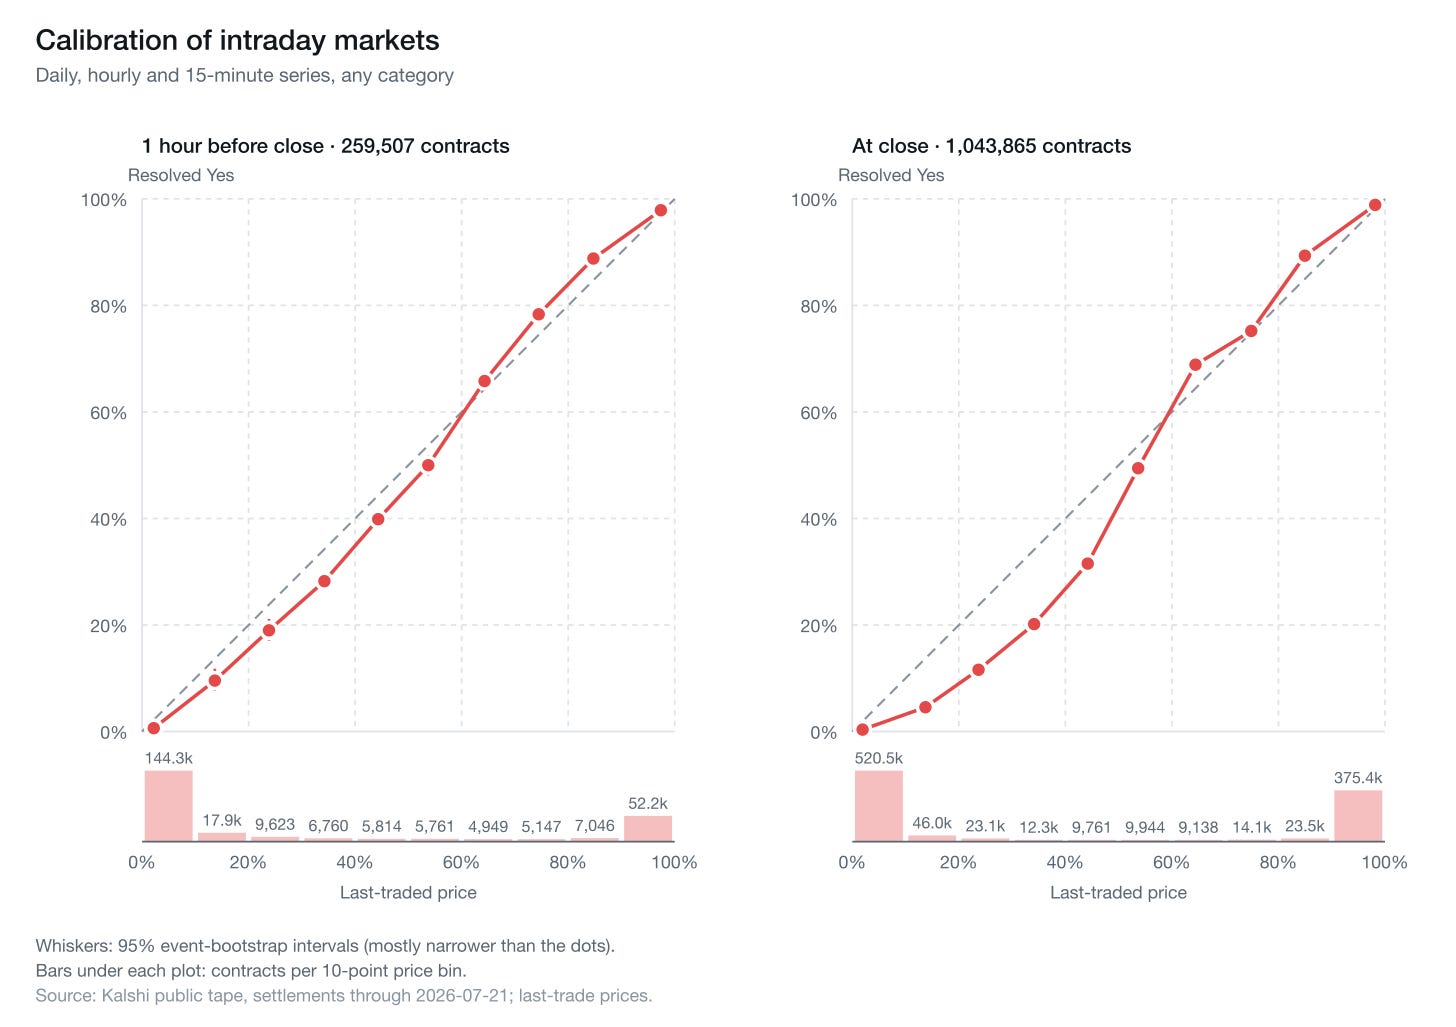
Even for these especially noisy markets, calibration 1 hour before close is fairly good. At close it gets worse, which is a bit awkward for my thesis here. I looked a bit into why that is the case but I do not have a good theory about what is going on there. I will share what I know though.
Badly miscalibrated markets there are all multi-option numeric ranges, like this market where you can bet if BTC will be above many different cutoffs on October 1st. Usually only two of the markets in a range are actually relevant at close. For example, if BTC is sitting at $110,248, the markets saying it will be above $110,200 and $110,250 still carry a lot of uncertainty. All the other markets will be close to 1¢ or 99¢. And that is it, that is what I know. Opus did spin up a story about takers being biased towards Yes but it sounded just-so and I couldn’t verify it.
In any case, the same applies for Crypto markets whose lifetime was at least a week. They are not hugging the perfect calibration diagonal, but they do just fine:
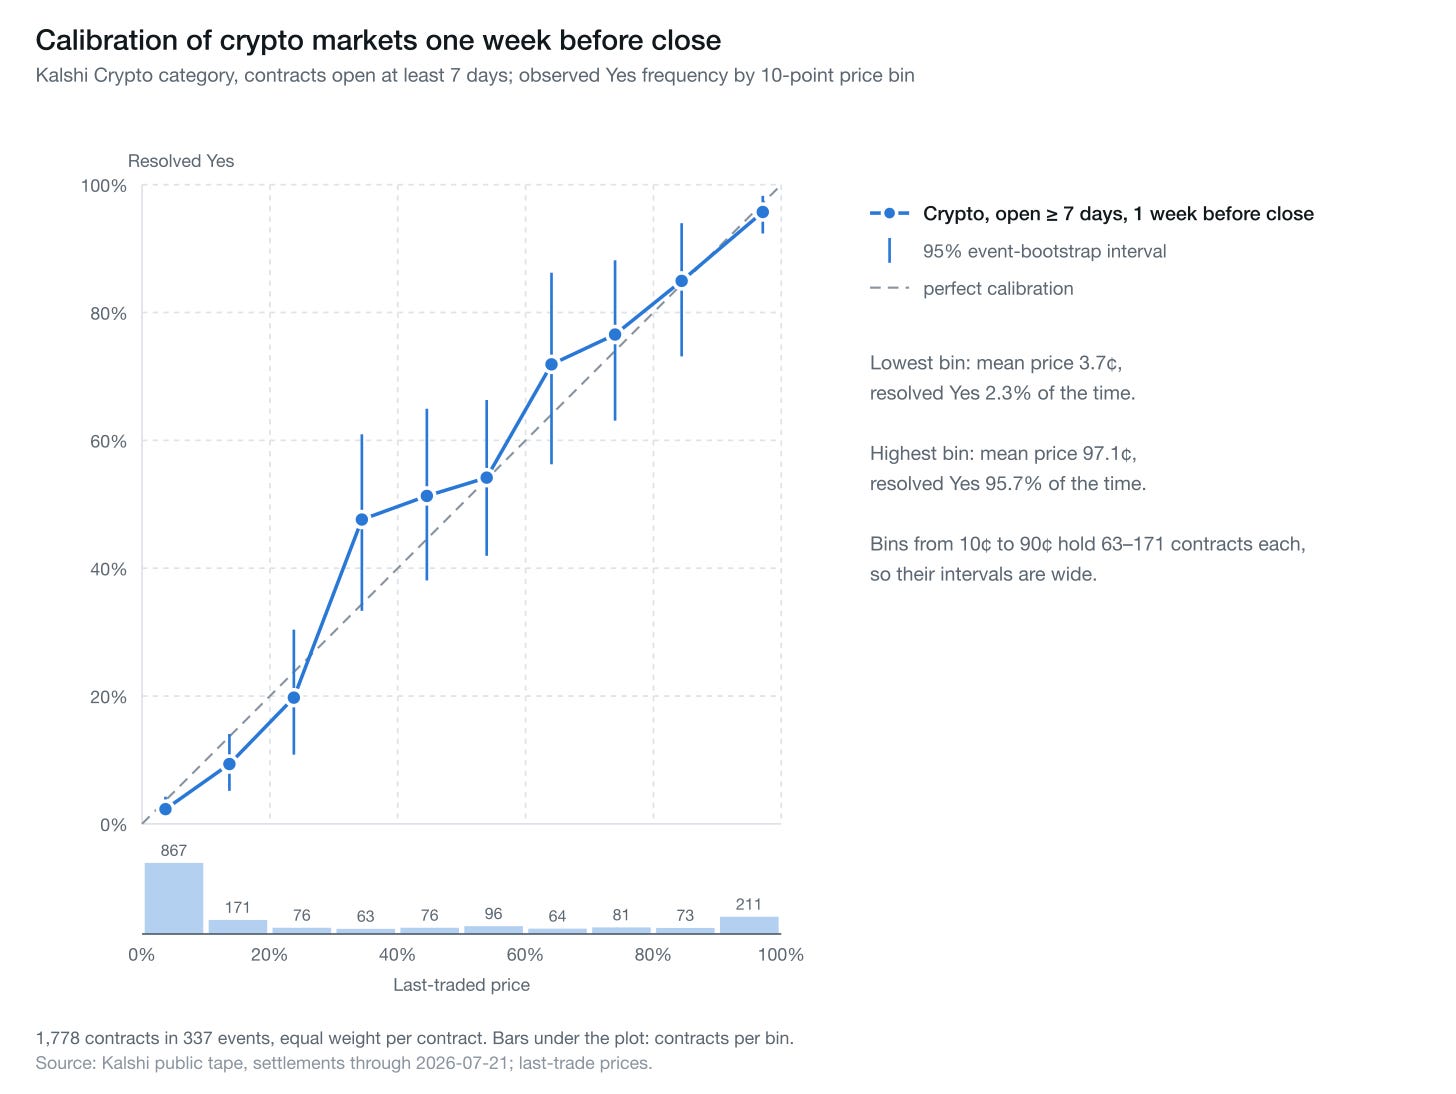
So that is the point. Kalshi’s markets are well-calibrated. Yes, the calibration diagrams look more impressive if you remove the bulk of the platform. That is to be expected though, predicting noise is a harder problem. With that said, even those noisy markets still appear reasonably calibrated.
However, there is a problem in some of their discussions. The paper keeps equivocating between calibration and the Brier score.
For example, section 4.1.1 starts by saying
Brier scores summarize calibration in a single number, whereas reliability diagrams reveal its shape.
The first part of that sentence is not true.
For example, suppose you are forecasting the result of 100 coin flips and you predict each will come up Heads with probability 50%. In this case, we know from construction you are perfectly calibrated: the coins in fact should come up Heads about half the time. If we run the experiment many times, we expect to observe pretty good calibration empirically, but it may not be perfect every time. Almost 3% of the samples will have 60 or more Heads. If that was the sample we got, you would look miscalibrated, and we can say exactly by how much. However, your Brier score will always be 0.25 regardless of the results of the coin flips. Your measured calibration can vary even if your Brier score does not.
I can’t come up with a good reason why they got this wrong. The paper even cites Murphy (1973), which presents a decomposition of the Brier score as uncertainty - resolution + (mis)calibration. I have discussed uncertainty and calibration, now I will turn to resolution. Notably, Kalshi’s paper does not share any resolution results, so a cynical reader could reasonably expect their resolution to be bad. That is not the case though.
Before I show the resolution chart, let me just explain what resolution even is. Basically resolution measures how much of the variance in the outcomes your forecasts explain. Uncertainty is the total variance in the outcomes, so resolution can never exceed uncertainty. Remember, uncertainty comes from the base rate and can be at most 0.25. Since good forecasters are usually well-calibrated, their Brier scores will typically be very close to the uncertainty of the problems minus their resolution.
A consistently miscalibrated forecaster with high resolution can still be quite useful, you could still infer informative probabilities from their forecasts. However, a perfectly calibrated forecaster with 0 resolution brings us nothing. That performance can be achieved, for example, by always betting the base rate on every question. Low-resolution forecasts do not tell us what is more versus less likely to happen.
The chart below shows resolution on the sample including only markets that existed 1 month before resolution, excluding Sports, Mentions and intraday markets:
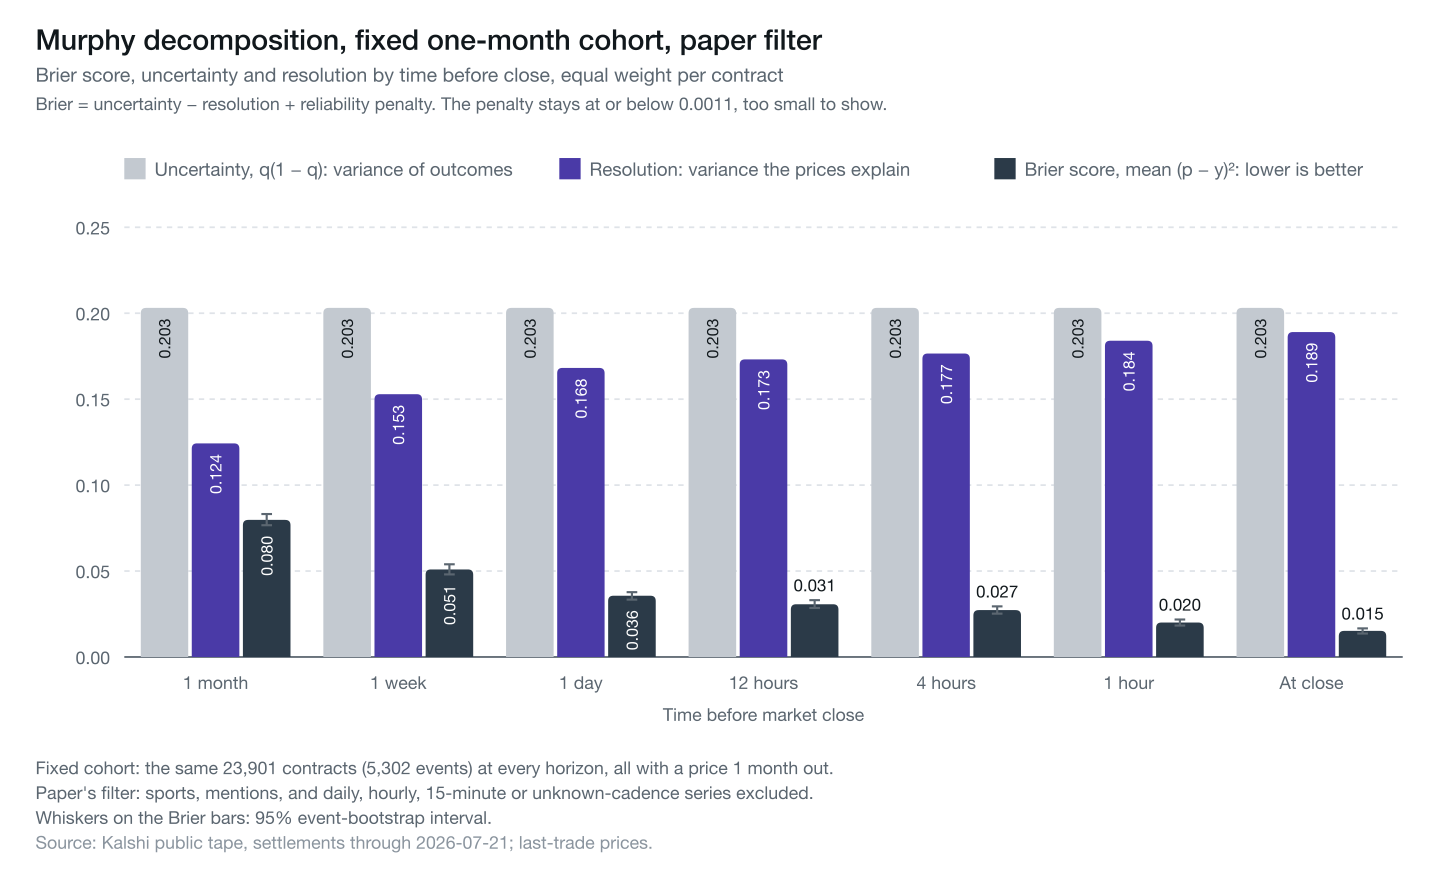
Notice first how the Brier score is in fact very close to uncertainty minus resolution (black bar stacked on purple bar equals gray bar). That is because the markets are calibrated. But they also do display some level of resolution.
The fact that we have non-negligible resolution in highly-calibrated markets strongly suggests there is forecasting skill involved. It could still be the case that prediction markets are not doing a particularly good job compared with other baselines. It could be the case that achieving this level of performance is actually very easy. In a vacuum, it is hard to say.
People have compared the performance of markets with other forecasts, I have also done that and will write more about it in the future. Comparisons like that can help us understand just how good the markets are. If they consistently underperformed against reasonable baselines, we could argue they do not forecast well. Of course, to identify mispricings is to fix them. The markets do incentivize information to reveal itself.
To tell the same story resolution told us but using a different metric, if we use the standard Brier skill score, comparing each cohort with the base rate for its markets only, the markets still look good:
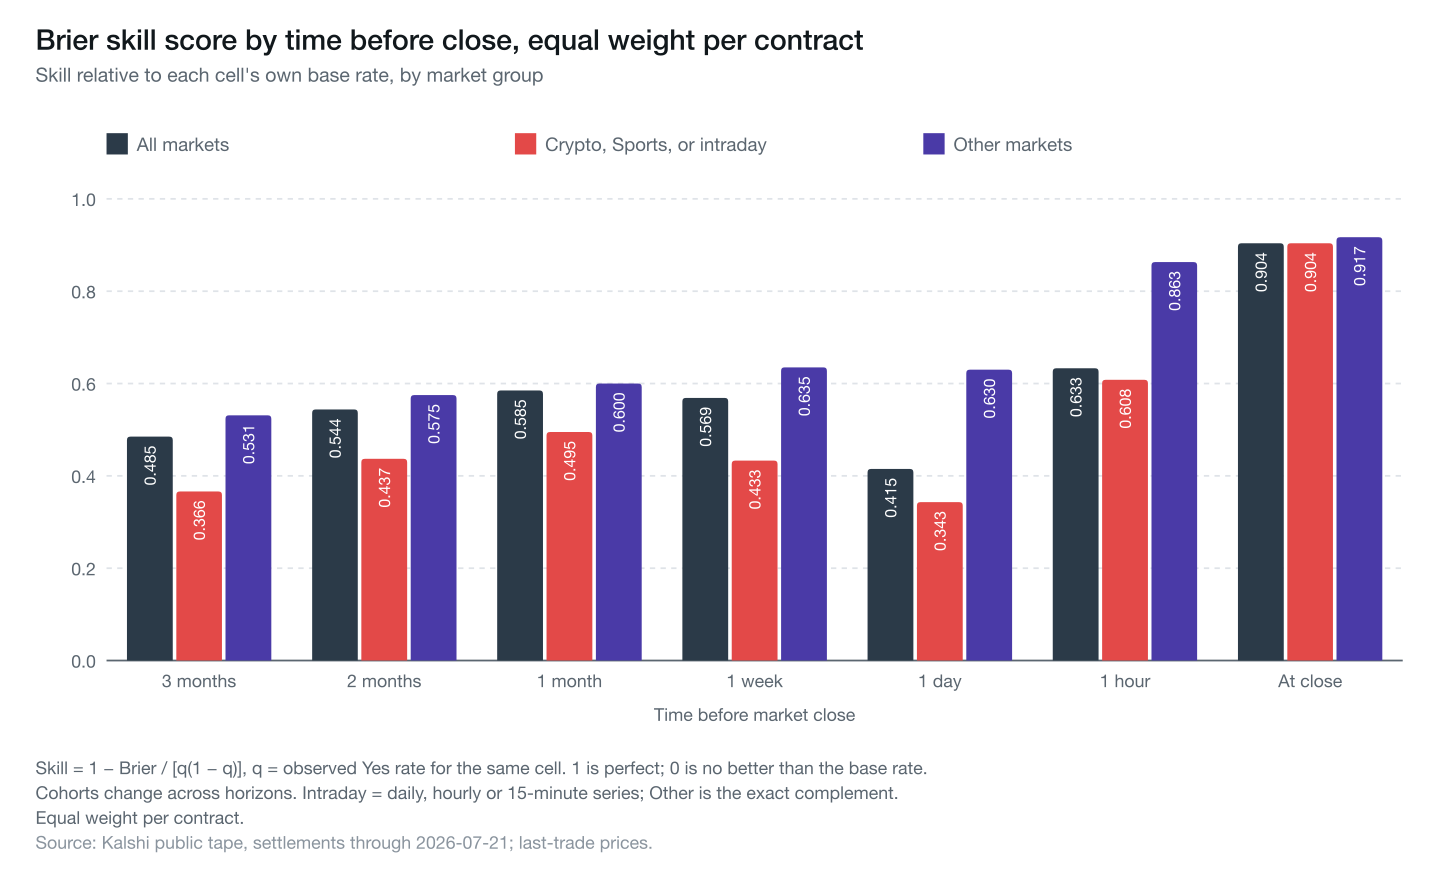
A Brier skill score of 1 means perfect skill, 0 means performance as good as the base rate. Clearly, there is some amount of skill being displayed. Notice that the strongly recreational crypto+sports+intraday markets display less skill than the other markets, as expected, but still display positive skill.
Inconsistent numbers and puzzling results
There are a few inconsistencies in the paper’s numbers:
The abstract says Kalshi comprises 2,243,741 markets from its launch in 2021 through mid-2026, but summing the per-category counts in table 1 yields a larger number, 2,324,075.
Table 1 says there were 6,064 election markets in the sample, table 4 has 4,226.
Summing the bucket counts at close in table 2 yields 79,504 markets, table 3 gives 85,315.
I don’t think these mean much. They likely arise from slight differences in how the samples are built. Those differences either went over my head or were not properly explained, which happens. Though it should be noted that both GPT-6 and Fable 5.1 consistently caught those apparent inconsistencies when prompted to look for mistakes in the paper.
Fable’s analysis screenshotted in the X post by @DeepDishEnjoyer brings up 8 “other crimes” by the paper. Some of those I have echoed but most I just consider overblown. I will address one of them here.
Fable claims that the authors excluding markets priced below 2¢ or above 98¢ is fishy since Bürgi et al. (2025) found a favorite-longshot bias. I think the criticism is misguided, but while investigating it I realized that calibration estimates do rely on binning choices, and the calibration charts in the paper are coarse enough that I had no idea how tail markets perform. So I charted calibration for two tail ranges: 0-5% and 95-100%, with small bins. The charts look quite bad (edit: it isn't really bad9). Take a look first at the one for the full sample of all settled markets ever:
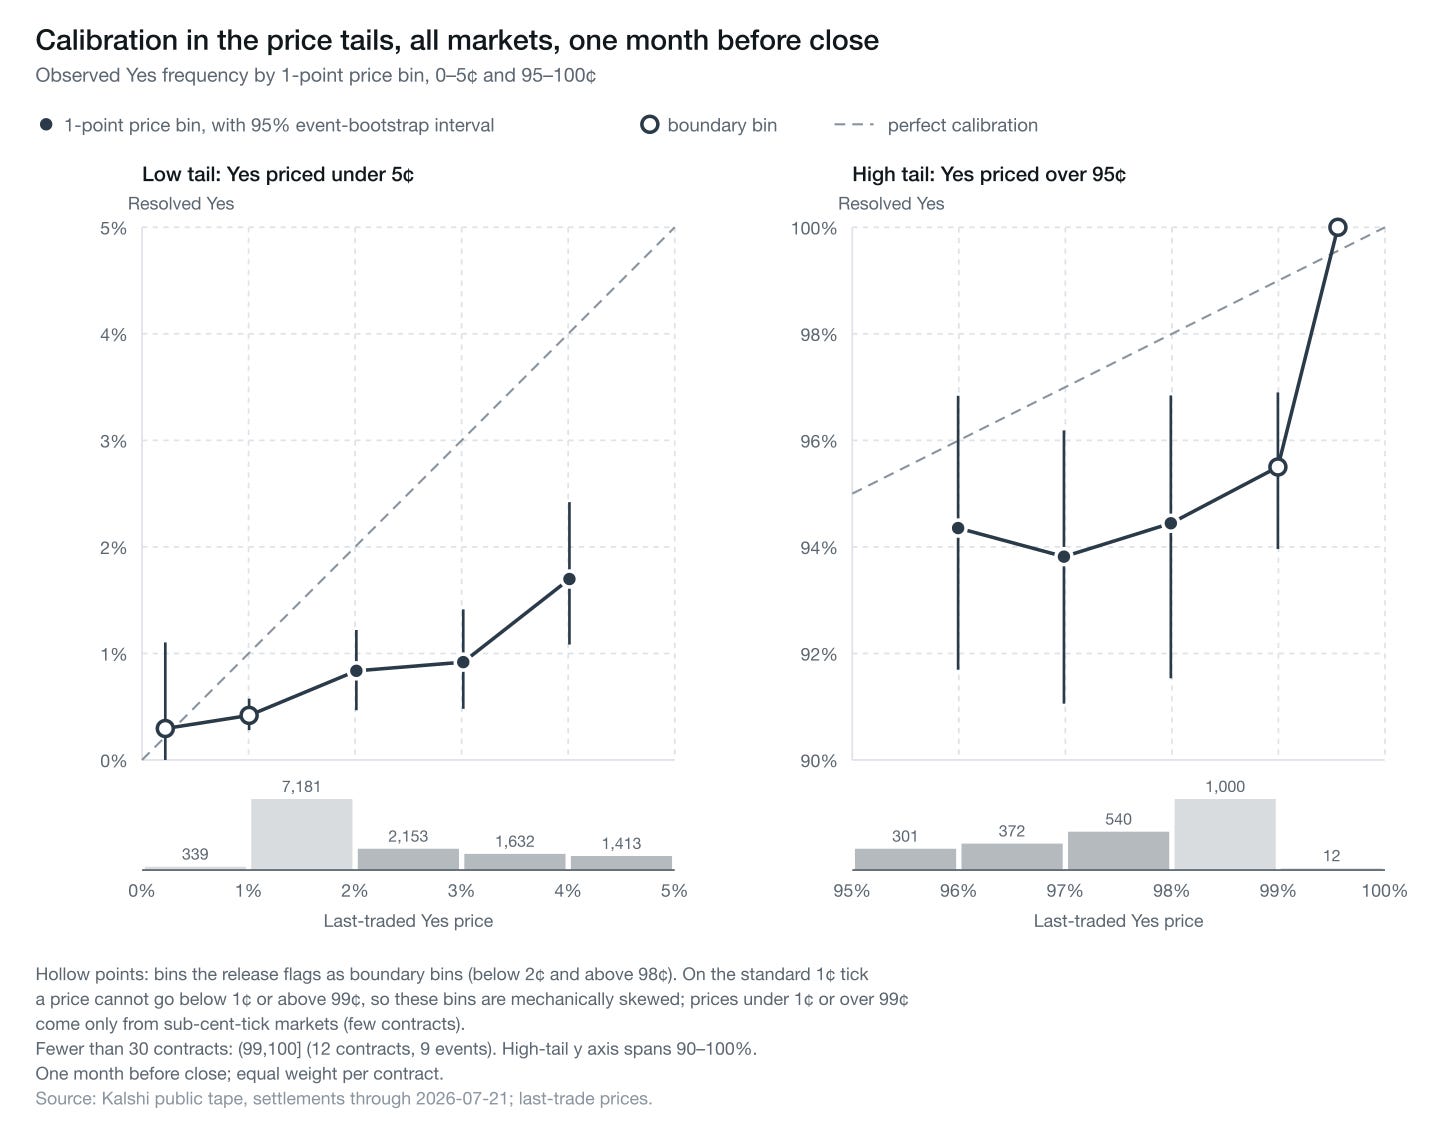
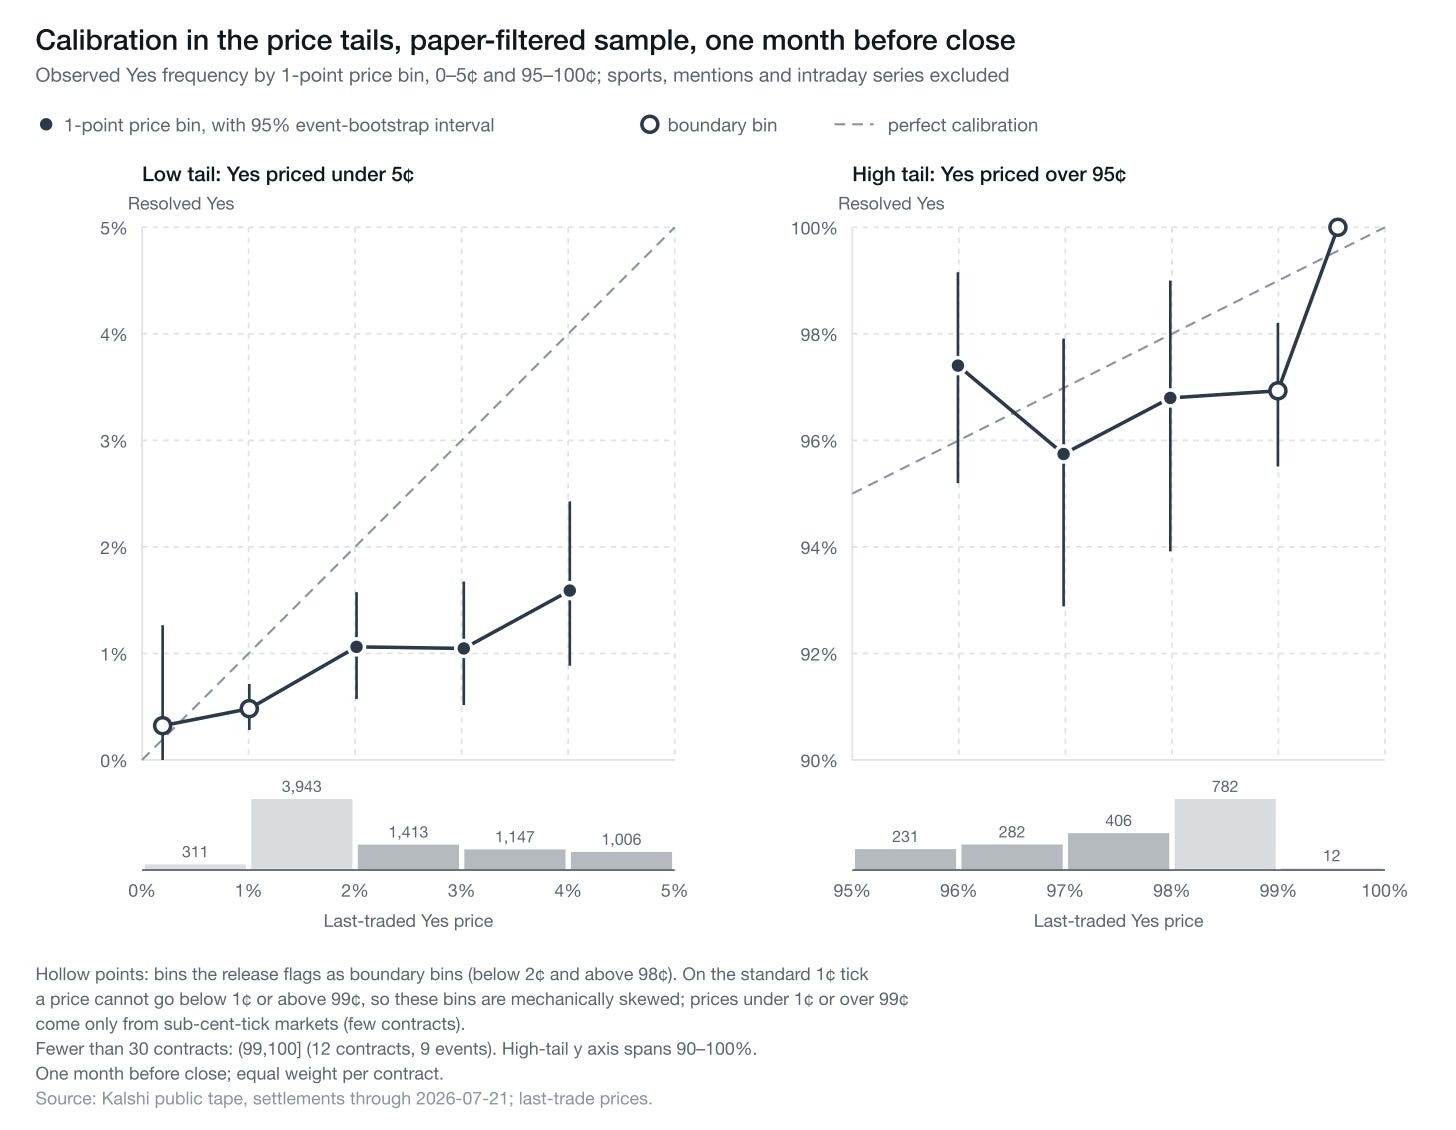
The 95-100% tail improves a bit if we throw away sports, mentions and intraday:
Kalshi’s API does not allow me to track traders’ identities, which is fair but means that I can’t replicate the association between trader count and Brier score. They give us this chart:
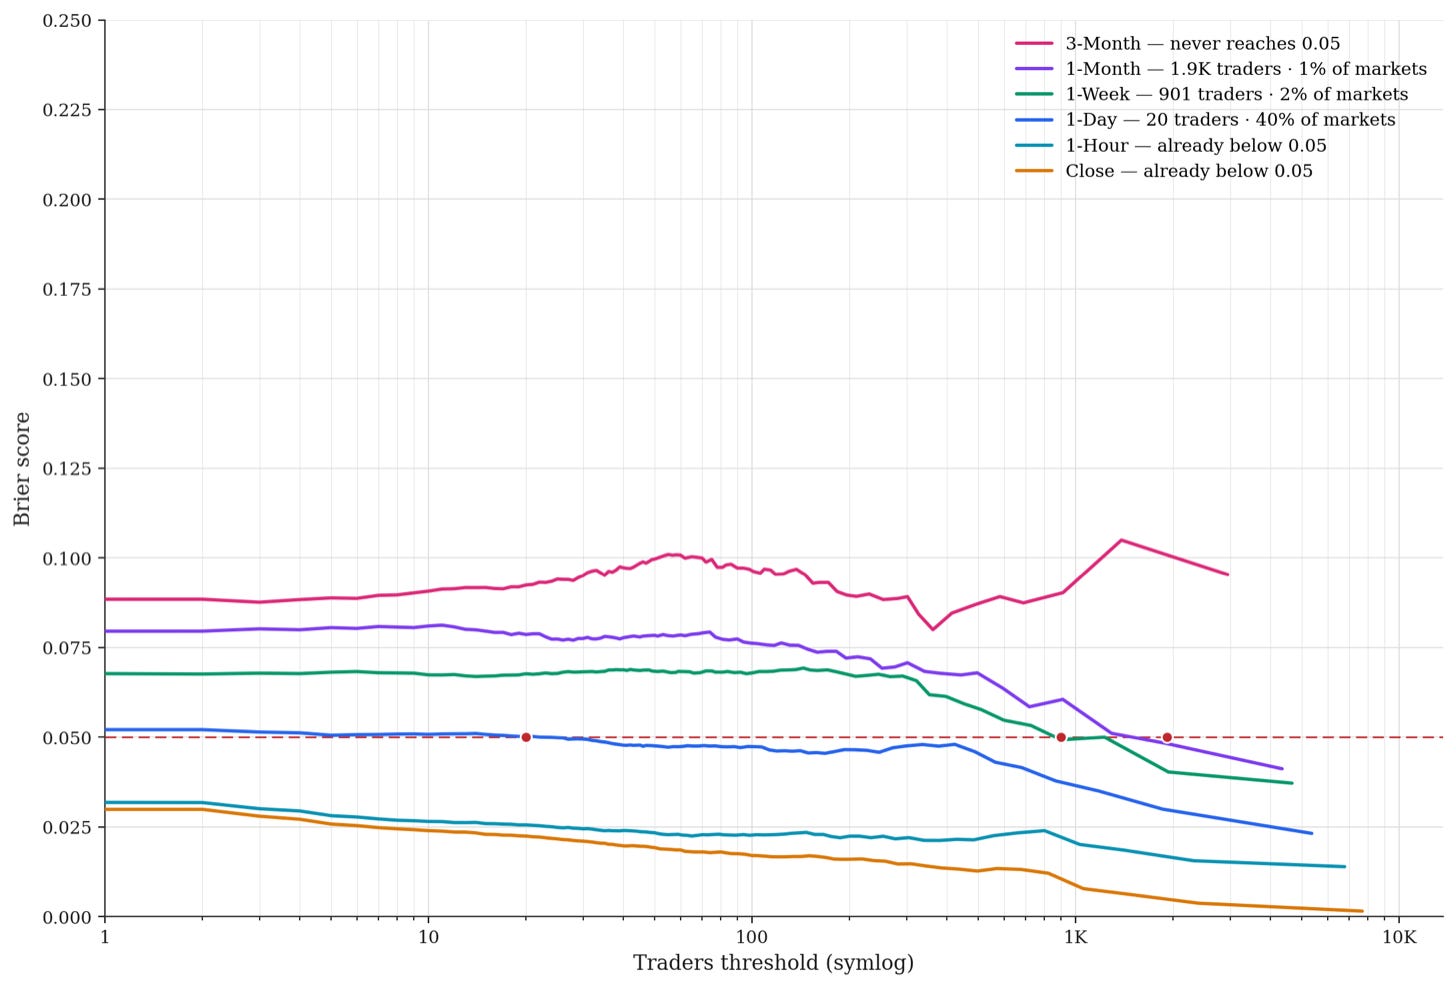
There is an association between good performance (low Brier) and number of traders, but it is hard to confidently ascertain why. Maybe easy markets attract more traders. Maybe a high number of noise traders attracts sharks. The authors do draw inferences of the sort “adding more traders helps but waiting a bit often helps more”, which is tempting but I think does not work? Everything is just too confounded.
I was able to investigate the relation between trading volume and the Brier score, but there is enough I want to say about it that I have decided to leave that for a later article.
In sum, though arguably too much of Kalshi is pure gambling, their markets are about as good as the paper they released claims they are. Their results are unsurprising and reasonably accurate. They get some things wrong and do not frame results in a way that goes strongly against Kalshi’s interests, but I don’t see why we should expect that. I have no idea where the $40B valuation in Kalshi’s current investment round comes from, but the picture in my mind is that they offer almost zero economic value if you take gambling away. Personally what made me interested in prediction markets was the potential for applications in business and the nonprofit world, so this is disappointing. Still builders interested in using prediction markets as a primitive for decision-making might gain something from paying attention to how Kalshi’s markets work. I may also try to explicitly learn such lessons in a future post.
Opus 5 was used to double-check Sol’s opinions, they agreed on the exact 1-5 score 2/3 of the time, but that jumps to over 96% on the question of whether the market was “recreational” (scores 4 or 5).
There are actually hourly up-or-down temperature markets, which arguably look even more aimed at gamblers.
NOAA’s data reveals that LAX’s average daily high was 75.1°F in July in the years 1991-2020. Downtown LA averaged 82.0°F, and Woodland Hills was even hotter at 95.1°F.
It is not fully clear how the authors defined intraday so I went with an approach that yielded sample sizes similar to the ones reported by the authors. Basically I considered a market intraday if its series ran at least daily.
Among markets settled in 2025 belonging to the Crypto category, 97.5% (90.9% by volume) were intraday.
In the same 2025 frame.
The Brier score is simply the mean squared error of forecasts, given by BS = (1/N) ∑ᵢ₌₁ᴺ (fᵢ − oᵢ)², where fi is the forecast probability of Yes and oi is 1 if contract i resolved Yes and 0 otherwise. So in the case of forecasting No with 100% probability for every contract in the extra-innings series, the result becomes BS = (1/N) ∑ᵢ₌₁ᴺ (0 − oᵢ)² = (1/N) ∑ᵢ₌₁ᴺ oᵢ = p = 113/1351 ≈ 0.084
This can be seen by differentiating the Brier score formula and equating it to 0. Substituting the base rate back into the Brier definition, we can compute the Brier score of the constant base-rate forecast, which is given by p(1−p), where p is the base rate.
Visually zooming into the small box makes it look more miscalibrated, but the different between predicted probabilities and observed frequencies is just a couple percentage points. In the chart going from 0 to 100%, it goes over 5%. I believe this “bias” amounts to a chart trick.